🧠 Production Possibility Curve (PPC)
💡 What is a Production Possibility Curve?
A Production Possibility Curve (PPC) is a graph that shows the maximum possible output combinations of two goods or services that an economy can produce when all resources are fully and efficiently used.
It helps to show:
- Scarcity (limited resources)
- Opportunity cost (the next best alternative given up)
📈 Drawing and Interpreting a PPC
Here’s a basic PPC showing Good A and Good B:
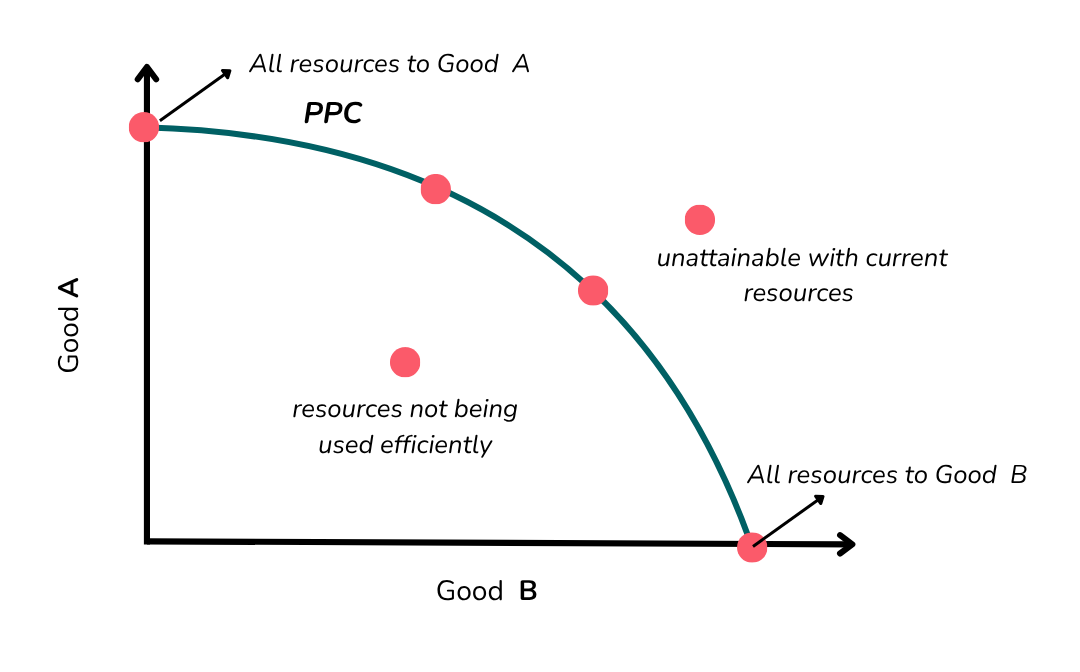
- The curve shows combinations of Good A and Good B that can be produced with available resources.
- Points on the curve represent efficient use of resources.
- Points inside the curve mean resources are not fully used (inefficient).
- Points outside the curve are not possible with current resources.
📍 Location of Points on the PPC
| Point Location | Meaning |
|---|---|
| On the curve | Efficient use of all resources |
| Inside the curve | Inefficient use (e.g. unemployment, waste) |
| Outside the curve | Currently unattainable without more resources |
➡️ Example: If a country produces only 100% of Good A, it produces none of Good B — that’s a trade-off. If it wants more of Good B, it must give up some of Good A (opportunity cost).
🔄 Movements Along vs. Shifts of the PPC
✅ Movement along the PPC:
- Happens when production shifts between the two goods.
- Cause: Reallocation of existing resources.
- Consequence: Increase in one good = decrease in the other (opportunity cost).
➡️ Example: Moving from point X to Y on the curve to produce more of Good A and less of Good B.
🔁 Shift of the PPC:
- The entire curve moves outward or inward.
🔺 Outward Shift (PPC moves away from origin):
-
More can be produced of both goods.
-
Causes:
- Increase in resources (e.g. more workers, land)
- Improved technology
- Better education/training
-
Consequences:
- Economic growth
- Higher potential output
🔻 Inward Shift (PPC moves toward origin):
-
Less can be produced of both goods.
-
Causes:
- Natural disasters
- War
- Loss of labor or capital
-
Consequences:
- Lower productive capacity
- Fall in potential output
🔁 Summary Table
| Concept | What It Shows | Key Point |
|---|---|---|
| PPC | Max possible output combinations | Based on full, efficient use of resources |
| Point on curve | Efficient production | Economy using all resources |
| Point inside curve | Inefficient use | Some resources are unemployed/wasted |
| Point outside curve | Unattainable currently | Needs more resources or technology |
| Movement along PPC | Reallocation of resources | Opportunity cost involved |
| Shift of PPC | Change in productive capacity | Shows growth (outward) or decline (inward) |
🧠 Final Tip:
Always remember:
The PPC is a simple but powerful tool to show choices, opportunity costs, efficiency, and economic growth or decline.